
NFP Friday is Upon Us… How Will The Market Trade Today?
05-02-2025
Traders,
Let’s start the newsletter with the Higher Time Frame (HTF) on the S&P 500 again.
We have been bullish because the HTF is telling us price action is showing bullish moves.
Let’s recap the monthly chart.
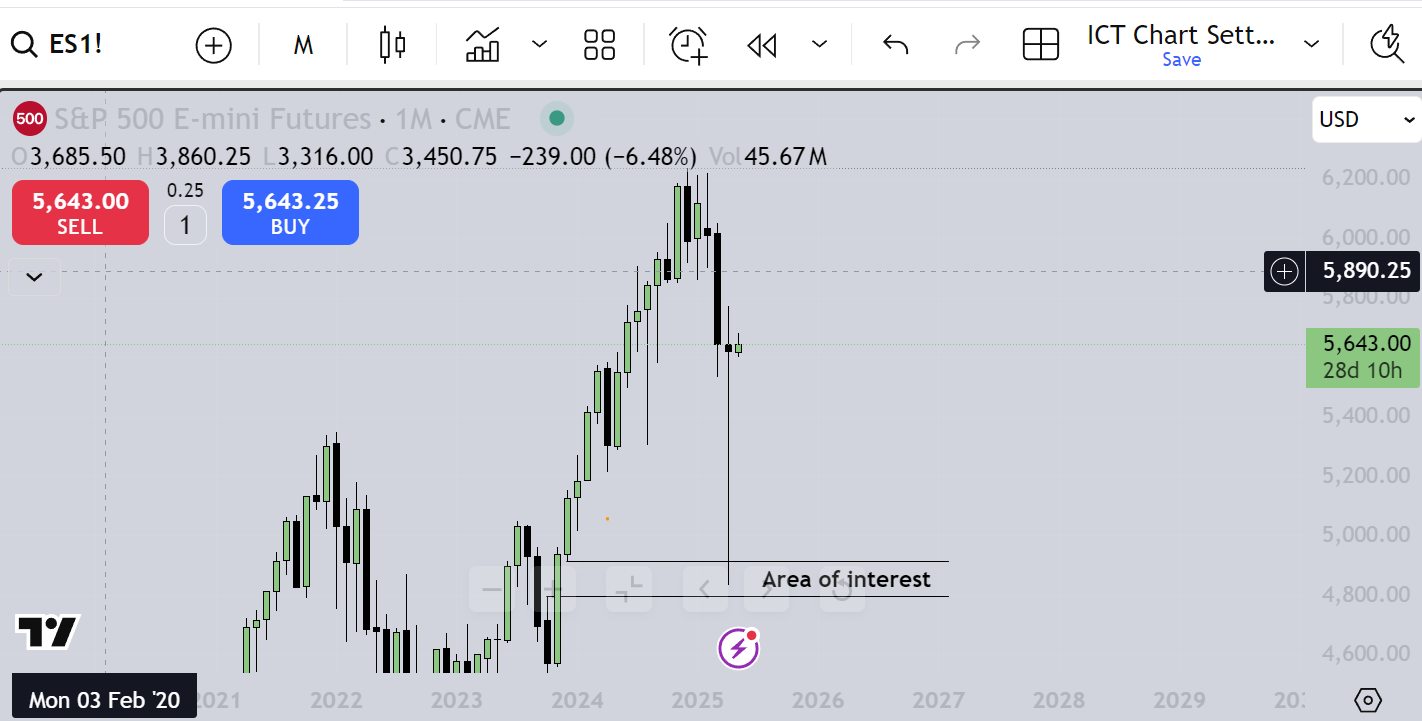
You can see a big wick formed last month.
This is a sign of rejection.
More importantly, price is rejected in a key area of interest.
Long wicks mean rejection, especially in a higher time frame. (Confirmation #1)
On the weekly chart, this is what we saw.
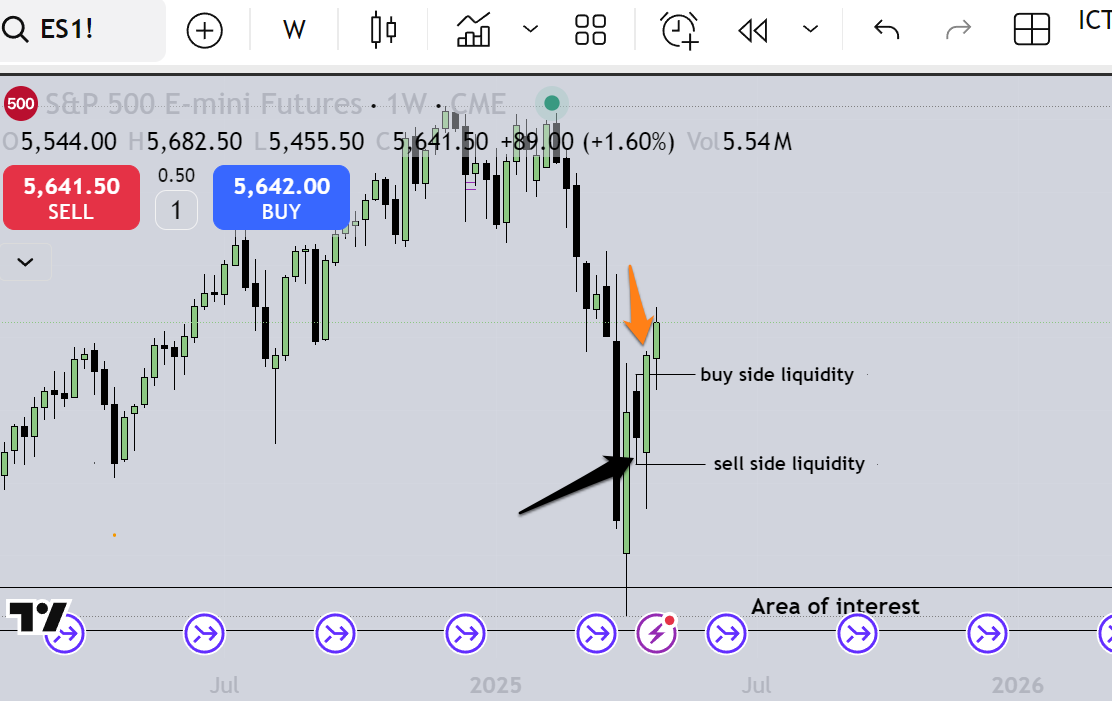
You can see the orange arrow pointed to last week’s weekly candle.
It is a bullish engulfing candle.
It took out sell side liquidity and buy side liquidity from 2 weeks ago (black candle).
Sell side liquidity is where traders place sell stops when they go long.
Buy side liquidity is where traders place buy stops when they take on a short position.
Last week’s bullish engulfing candle was also confirmation we’re in a bullish week. (Confirmation #2).
Now we look at the daily chart.
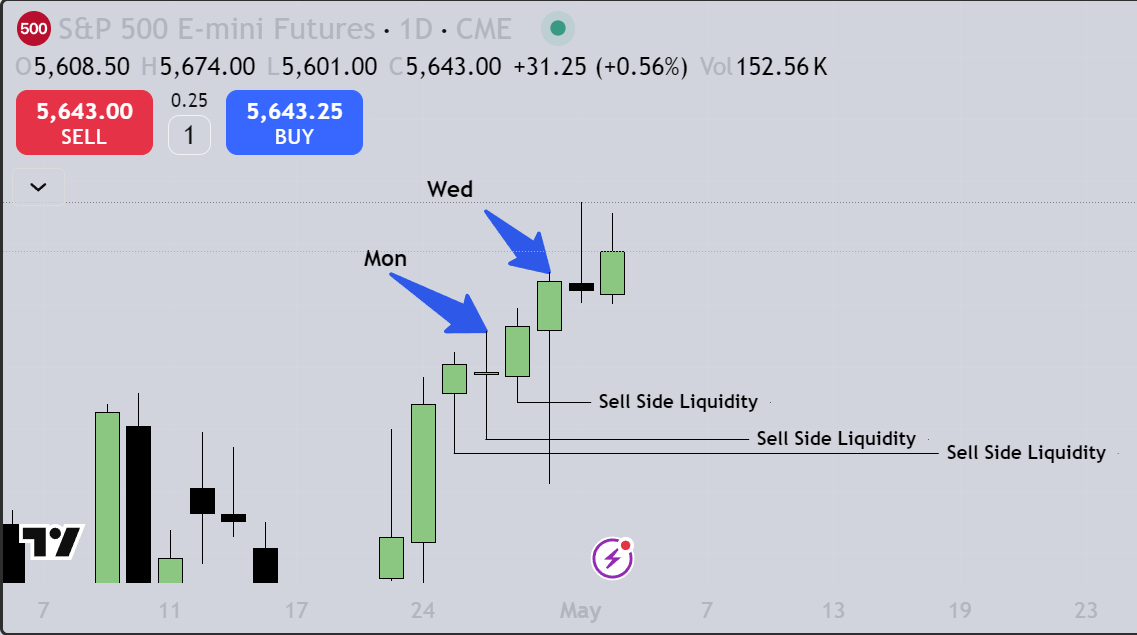
On Monday, the daily candle had a small body and long wicks (compared to the body).
On Tuesday, we had a bullish day.
Now Wednesday confirmed our bullish bias.
You can see we sold off first taking out liquidity from the previous 3 days. (very key for our bullish confirmation, Confirmation #3)
Bullish Price Action will have a run on sell stops before it trades back up.
This happens every time.
In our previous newsletter on Wednesday, we said the market maker was selling the market in the morning to buy it back during the 10AM news.
And this is exactly what took place.
Now what we want to know is how to trade today.
Let’s examine what happened yesterday and what’s on the economic calendar today.
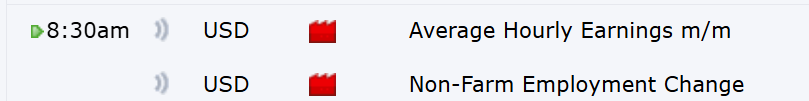
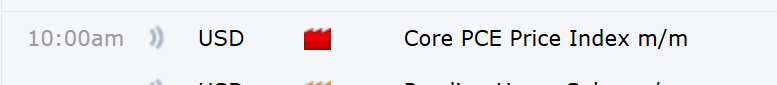
We have NFP at 830 AM Eastern.
This is arguably the most important economic event of the month.
It takes place on the first Friday of the month.
That means that the days leading up to this event are choppy and consolidating markets.
It usually trades sideways.
Let’s examine what happened yesterday on the 1 hour chart.
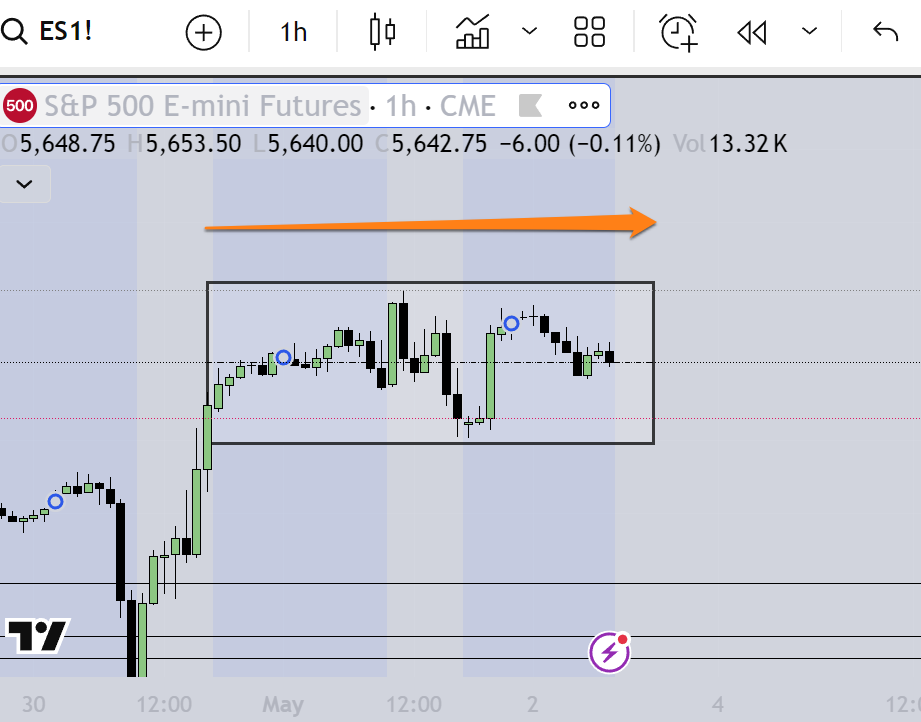
You can see that price mainly moved sideways.
Why?
It’s getting ready for NFP.
It’s creating liquidity for NFP to raid.
You’ll have sell stops and buy stops for price to trade through.
This is why it’s important to be very cautious on days leading up to NFP (usually Wed and Thurs).
I know professional traders who don’t trade these days due to the anticipated sideways movement.
It’s 8AM Eastern as I write this, so we still have 30 minutes until NFP .
What happens during NFP will be very telling on how we’ll trade the open.
Let’s remember that our bias is still bullish overall.
So we'll probably be leaning to look for bullish setups.
However, I’m not into predicting.
I trade what I see.
Once I see what the market’s intention is today, I will send out my trade alert.
I have won 94% of all my trades and boast a 67% ROI.
These are my last 10 trades.
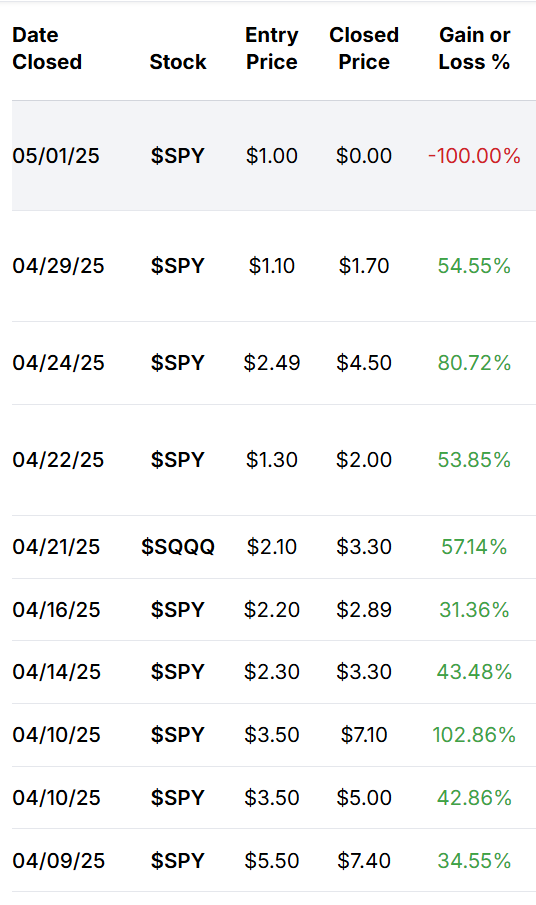
If you can win 9 out 10 trades you take, you have something there.
I invite you to trade along with me inside the Game Plan.
This is my service where I send out the trade alerts, usually pre market.
You know the entry, the exit and the option trade.
Don’t miss out on another great profitable trade!
Voz.